
Velkommen til Polar Portal
Her formidler DMI, GEUS og DTU de seneste observationer og den nyeste viden om is- og klimaudviklingen i Arktis
Heavy Snowfall in Greenland
This winter has seen a series of unusual weather hit the Arctic in general, it has been much warmer than average in the high Arctic since October though there have also been some periods of extreme cold, especially in western Greenland but also new high temperature records have been set in the east and north.
There has also been a succession of heavy storms hitting Greenland. Starting in October these storms have dropped a lot more snow than average over Greenland, particularly on the eastern side and in the south. This increasing mass has not gone unnoticed and we have received a number of questions about it, so here we attempt to summarise what we know and can infer about the winter 2016-2017 and what it might mean to the overall surface mass balance year 2016-2017.
The surface mass balance year goes from September to August, with most of the snow falling between September and May (known as the accumulation season) and melt generally dominating June-August (known as the ablation season). The accumulation season got off to a flying start in October, when a series of large storms hit the east coast of Greenland dropping 264mm of rain in the main town of Tasiilaq in 25 days, compared to the average for October of 83mm for the whole of October. Most of the precipitation from these storms fell as rain at lower levels but as this freezes in the surface snow over the ice sheet it still adds ice to the ice sheet. However, these storms also meant that Autumn was record warm in east Greenland with all DMI weather stations on the east coast recording the warmest or second warmest October on record. These records stretch back to 1873 in some places on the east coast.
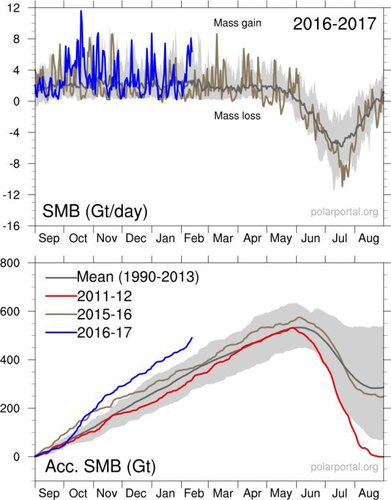
The October storms boosted the accumulation of snow over the ice sheet far above what is normal for the time of year as we see in the curve below, though since December, the amount of snow falling over the ice sheet has followed a more normal pattern.
 |
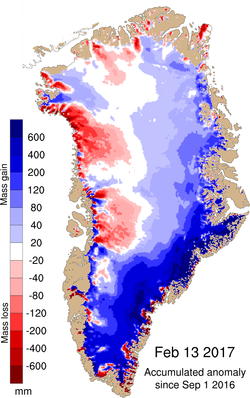
If we look at the picture over the whole of Greenland we can see that in fact northwest Greenland has actually had less snowfall than usual at this time of year. This is because north Atlantic storms have been driving up the east coast but north western Greenland has been relatively dry compared to the average.
The difference between the accumulated surface mass balance and the reference period is shown here. Blue colours indicate areas with a higher accumulation of snow than average. The red colours show areas with less snowfall than usual for the time of year.
The warm Arctic this winter and the amount of snow falling over Greenland are linked. Warm air can hold more water vapour than cold air. Projections from climate models suggest that as the atmosphere warms, there will also be increased snowfall over Greenland (particularly in the Southeast), however there will also be more melting and the question is really how far do these two processes balance each other. To date all model projections for the future suggest that melt and runoff will dominate over the increased accumulation of snow in a warmer world leading to retreat of the ice sheet and sea level rise. However, it’s important to remember that unusual winters like this one reflect regional weather patterns and on a climate timescale there is still significant variability from one year to another.
As we have stated before, the surface mass budget of the ice sheet is best viewed over a year or longer to get a sense of what is happening to the ice sheet – it is the difference between looking at weather and climate. When viewed over the year the three most important months for the annual surface mass balance budget are the summer ones of June, July and August. The amount of melting in the summer is much more important in determining the mass budget over the ice sheet than the winter months. It is therefore still far too early to suggest that the Greenland ice sheet will not lose more mass than it gains this year.
Finally, we should be clear that the period over which the observations or model simulations are made is important. On the polar portal we currently use a model reference period of 1990-2013 (the grey band in the top figure) that is relatively short and covers a period with relatively low precipitation when compared with the few longer records available from DMI weather stations. In the next few weeks we expect to update the surface mass balance product to reflect a newer improved version of the underlying model and this will also be referenced to a more standard 30 year period of 1981-2010.
Polar Portal is collaboration between DMI, GEUS, DTU-Space and DTU-Byg with funding from the Danish Energy Agency (Energistyrelsen).
Polar Portal is also on Twitter: @PolarPortal and Facebook: https://www.facebook.com/PolarPortal/
